Capabilities
psimulang is a block-structured language paired with Polytope, a reactive multidimensional engine. Together they cover the full arc from data loading and dimensional modelling through calculation, interactive reporting, and SQL interoperability — in a single coherent notation.

01 · The language
One notation,
data to render.
psimulang is a block-structured language with an explicit, keyword-delimited syntax. The same source file loads data, defines dimensions, writes calculation rules, and declares interactive reports — no separate query language, no separate scripting layer, no separate visualization DSL.
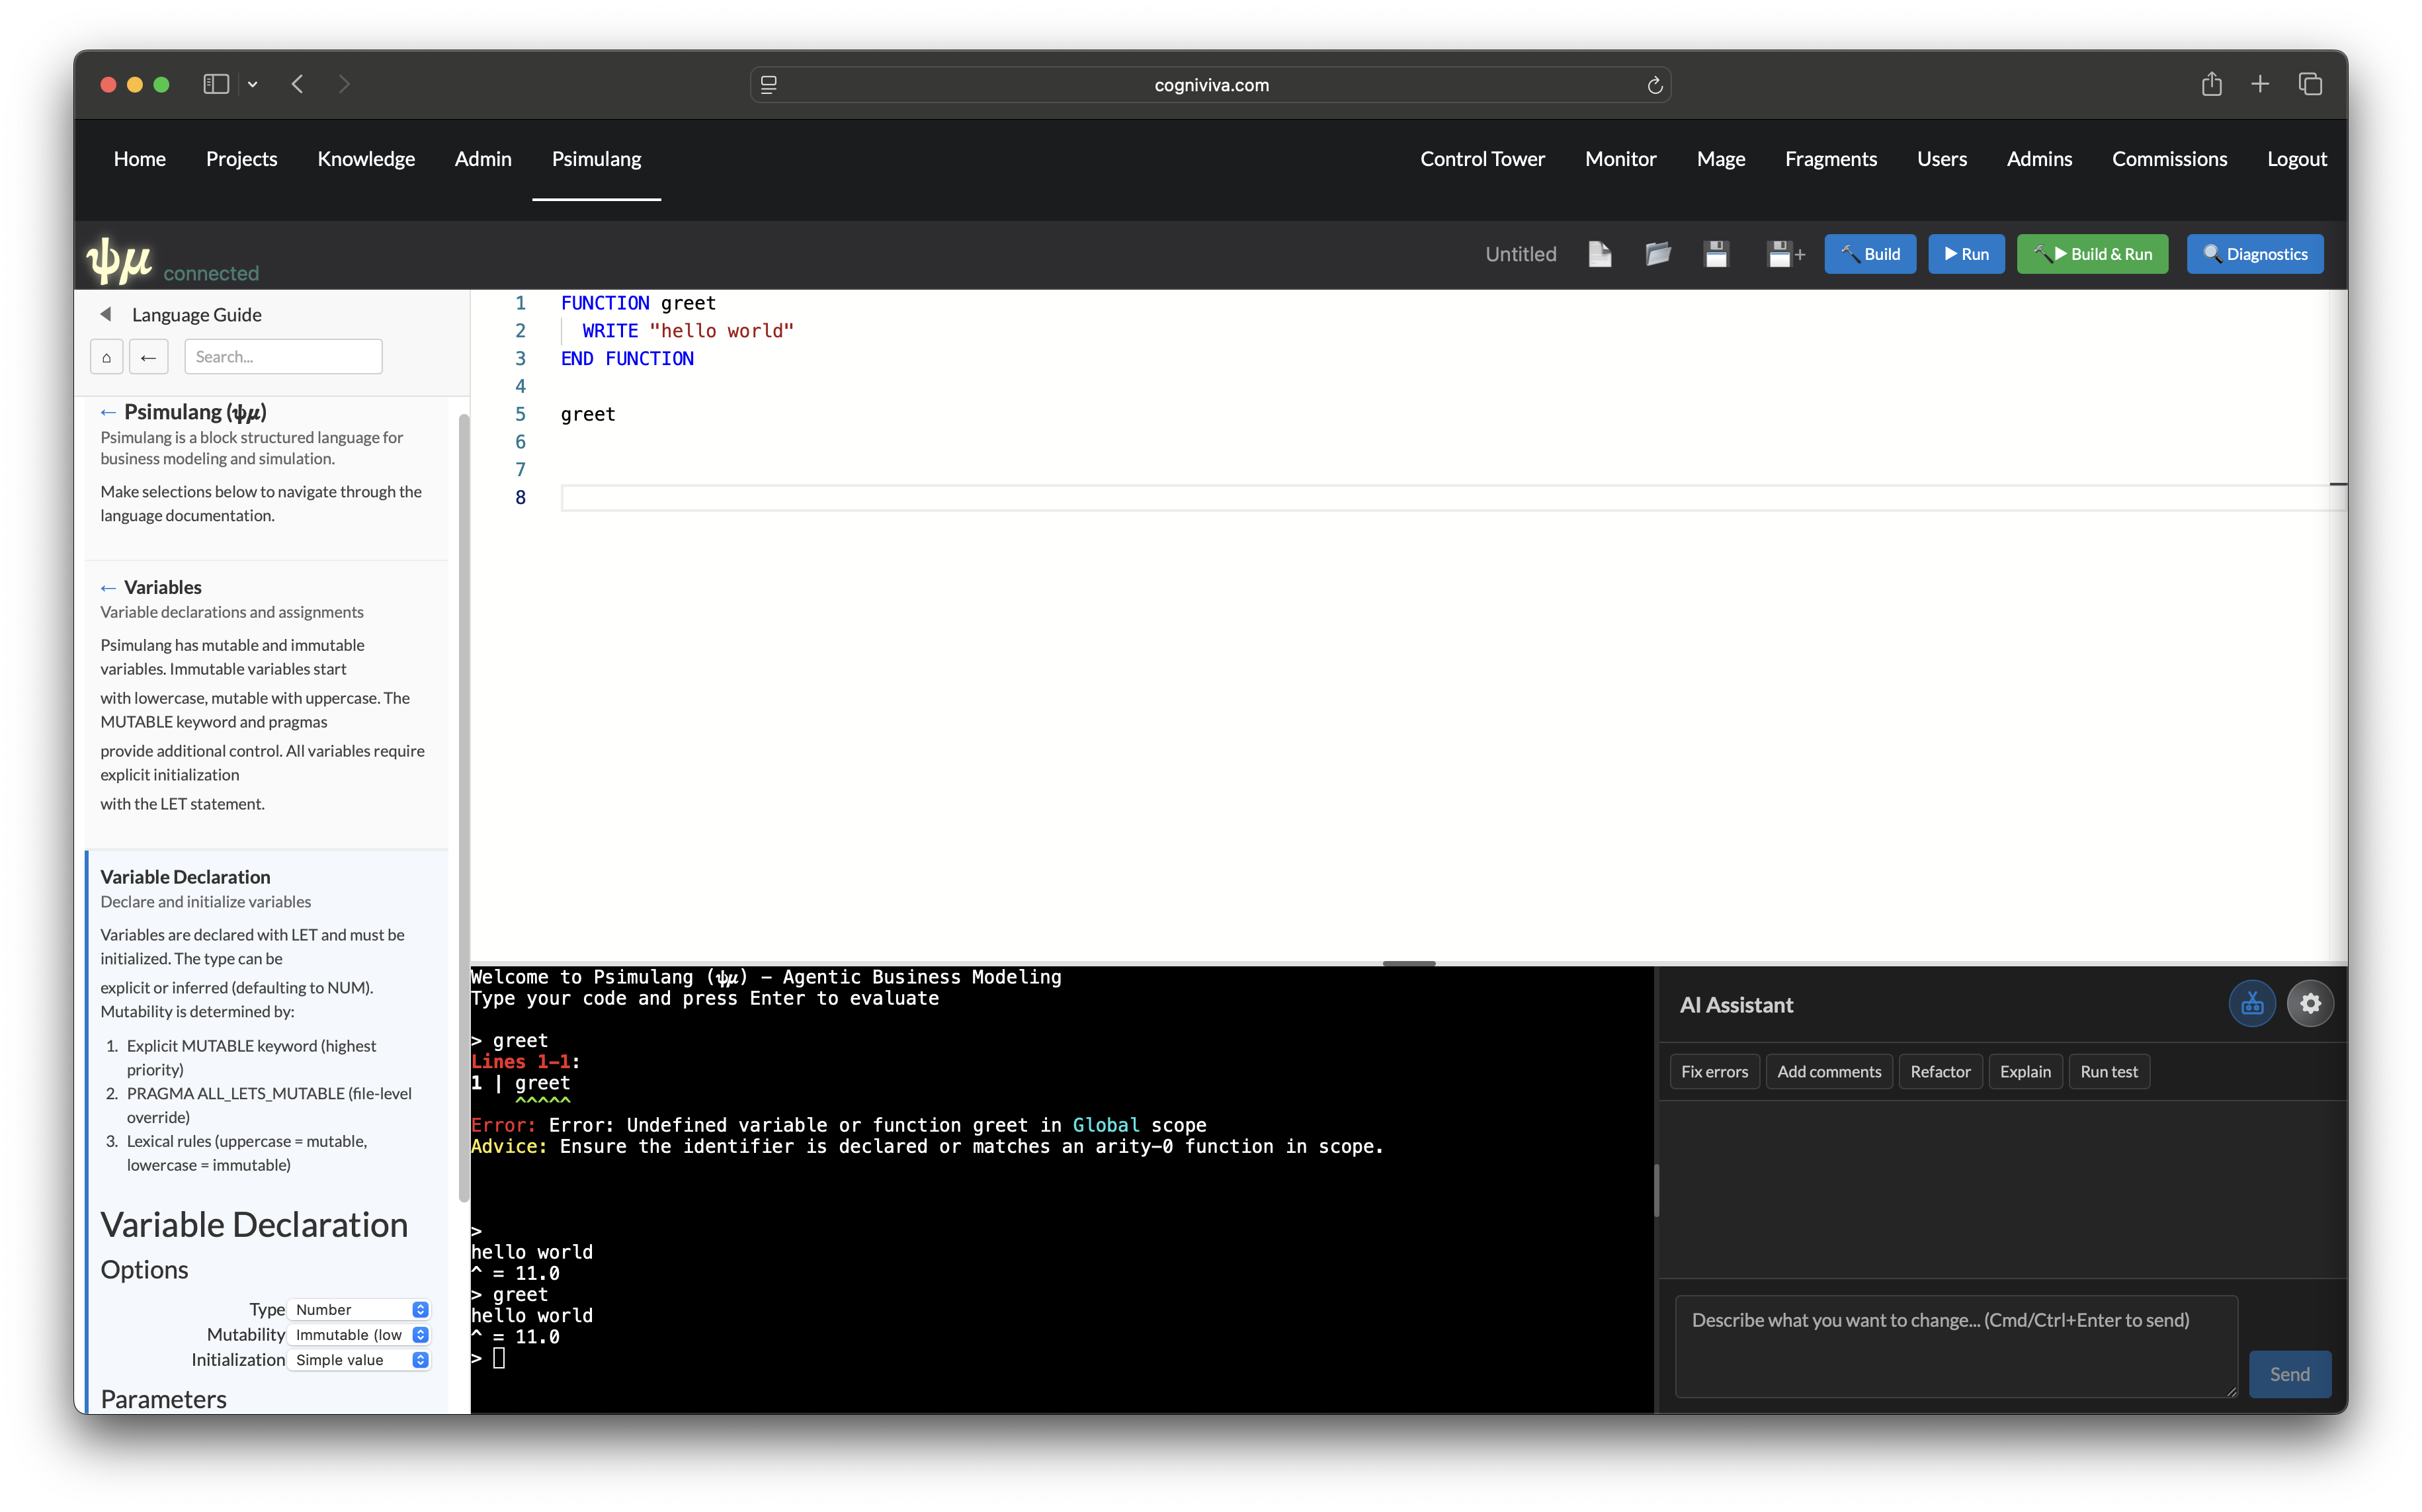
The syntax is designed to be readable and writable by both humans
and language models. Blocks open with a clear introducer line and
close with END.
When compilation fails, the engine emits semantic hints that guide
correction rather than bare parse errors.
- Four primitives: NUM, BOOL, TEXT, DATE
- Mutable / immutable by convention
- FUNCTION (named, recursive, typed return + params)
- LOOP · IF/THEN/ELSE · WHEN · WHILE
- 40+ built-in functions
- Full expression language + string concat
- LET / LET MUTABLE declarations, typed or inferred
- Semantic compiler hints on error
// Typed function; last expression is the return value
FUNCTION TEXT stockAlert(NUM qty)
    IF qty = 0 THEN "Out of stock"
    ELSE
        IF qty < 10 THEN "Low stock"
        ELSE "In stock"
        END IF
    END IF
END FUNCTION

// Immutable (lowercase); mutable needs LET MUTABLE or uppercase
LET onHand  = getStockLevel()
LET minimum = getReorderPoint()
LET MUTABLE Status = stockAlert(onHand)

// Single-line WHEN for side-effects; <- is the assignment operator
WHEN onHand < minimum  Status <- "Reorder now"

WRITE Status
Explicit block structure. Clear control flow. Same syntax whether authored by a developer or generated by an agent.
psimulang IDE — a browser-based editor with syntax highlighting, live diagnostics, an integrated REPL, and agent-assisted authoring. The same engine that runs reports runs the IDE; there is no separate interpreter.
- Syntax highlighting and bracket matching
- Live compilation diagnostics
- Integrated REPL — evaluate expressions in context
- Agent panel — propose and apply code edits
- WebSocket connection to the running engine
- CLI, CUI REPL, TUI REPL, and web — same source
02 · Dimensional data model
Name your axes.
Get rollups for free.
A DIMENSION declares a named axis — its members, hierarchical
relationships, and how parents aggregate from children. An ORTHO is a
multidimensional array spanning a set of dimensions. A MODEL assembles
ORTHOs and rules into a deployable analytical unit.
Polytope stores ORTHOs in either a dense backend (contiguous memory, SIMD-ready, up to 5D) or a sparse backend (HashMap, unlimited dimensions, efficient at low fill rates). The choice is per-ORTHO.
- Fields, hierarchies, longnames, attributes
- SUM / AVG / MIN / MAX / FIRST / LAST rollups
- Calculated hierarchy fields
- Membership sets (EXISTS IN semi-join)
- Dense storage: massiv, SIMD-ready
- Sparse storage: HashMap, unlimited dims
- Virtual (SQL-backed) ORTHOs
- Warm storage: fast-attach pre-computed generations
DIMENSION Time
    Jan | Feb | Mar
    Q1  = SUM Jan;Feb;Mar
    "Full Year" = SUM Q1:Q4
END DIMENSION

DIMENSION Region
    "North America" | Europe | APAC
    Global = SUM "North America";Europe;APAC
END DIMENSION

ORTHO Sales
    DIMENSIONS Product, Region, Time
END ORTHO

MODEL SalesCube
    ORTHOS  Sales, Targets
    RULES   Margin, YearOverYear
END MODEL
"Full Year" aggregates automatically from quarters — the hierarchy is declared once and reused everywhere.
RULE Margin (Product.*, Region.*, Time.*)
    ON Sales
    GrossMargin = Revenue - Cost
    MarginPct   = GrossMargin / Revenue * 100
END RULE

RULE YoY (Product.*, Region.*, Time.*)
    ON Sales
    PriorYear = SHIFT(Revenue, Time, -12)
    Growth    = (Revenue - PriorYear) / PriorYear * 100
END RULE

// Edit one input cell — only affected
// cells recompute, in dependency order.
// Readers always see a consistent snapshot.
Rules are declared against coordinate patterns. Polytope resolves the dependency graph and executes in order.
03 · Reactive engine
Change an input.
The right cells recompute.
RULE declarations express
business logic — "Margin = Revenue − Cost". Polytope builds the
dependency graph, resolves execution order, and recomputes only the
cells affected by a change. Readers always see a consistent, fully
resolved snapshot.
The engine supports three calculation entry points: a full model pass, a forward closure from changed seed cells, and an on-demand backward pass toward a target cell. A static numeric kernel compiles eligible rule expressions to a fast-path for interactive latency.
- Dependency-tracked unified cascade
- Atomic surfaces — consistent snapshots
- Cell write-back — propagates through rules
- Cross-ORTHO rule references
- SHIFT — time-series lead/lag
- Forward, backward & full recalculation
- Static numeric kernel (compiled fast-path)
- Circular dependency detection
- Lifecycle phases: START → VALIDATE → END
- STM-based concurrency, no locks
04 · Analytical measures
Every aggregate you'd expect —
and several you wouldn't.
Polytope's aggregate layer covers standard statistical measures, ranking and order statistics, composite probability expressions, and filter-context-aware query-time aggregates. Measures integrate with the reactive cascade — change the data or the filter context, and aggregate values update accordingly.
Standard
- SUM, AVG, MIN, MAX
- COUNT, COUNTDISTINCT
- Time intelligence: YTD, QTD, MTD
- PARALLELPERIOD, MOVINGAVERAGE
Statistical
- STDDEV, VARIANCE
- MEDIAN
- PERCENTILE(n, expr) — any percentile
- CORREL, COVAR
Ranking
- RANK, DENSERANK
- SELECT TOP / BOTTOM n
- SORT BY aggregate value
- Per-context independent ordering
Composite & scaled
- Ratio-of-sums expressions
- Probability-complement aggregates
- Selected-component recomposition
- Leave-one-out contribution
Filter-aware
- Query-time aggregates respect active filter context
- Cascade-aware scoring for SORT BY
- Aggregate cache deduplication within a render
Vector & matrix
- SUMPRODUCT
- TRANSPOSE, MMULT
- MINVERSE, MDETERM
RULETABLE SalesMetrics
    RULE RevenuePercentiles
        ON Sales
        P50 = PERCENTILE(50, SalesGenre, Month.*)
        P90 = PERCENTILE(90, SalesGenre, Month.*)
    END RULE
    RULE AvgSaleValue
        ON Summary
        AvgRevenue = SUM(SalesGenre, Month.*) / SUM(UnitsGenre, Month.*)
    END RULE
END RULETABLE
05 · Interactive reporting
Reports, channels,
drill, write-back.
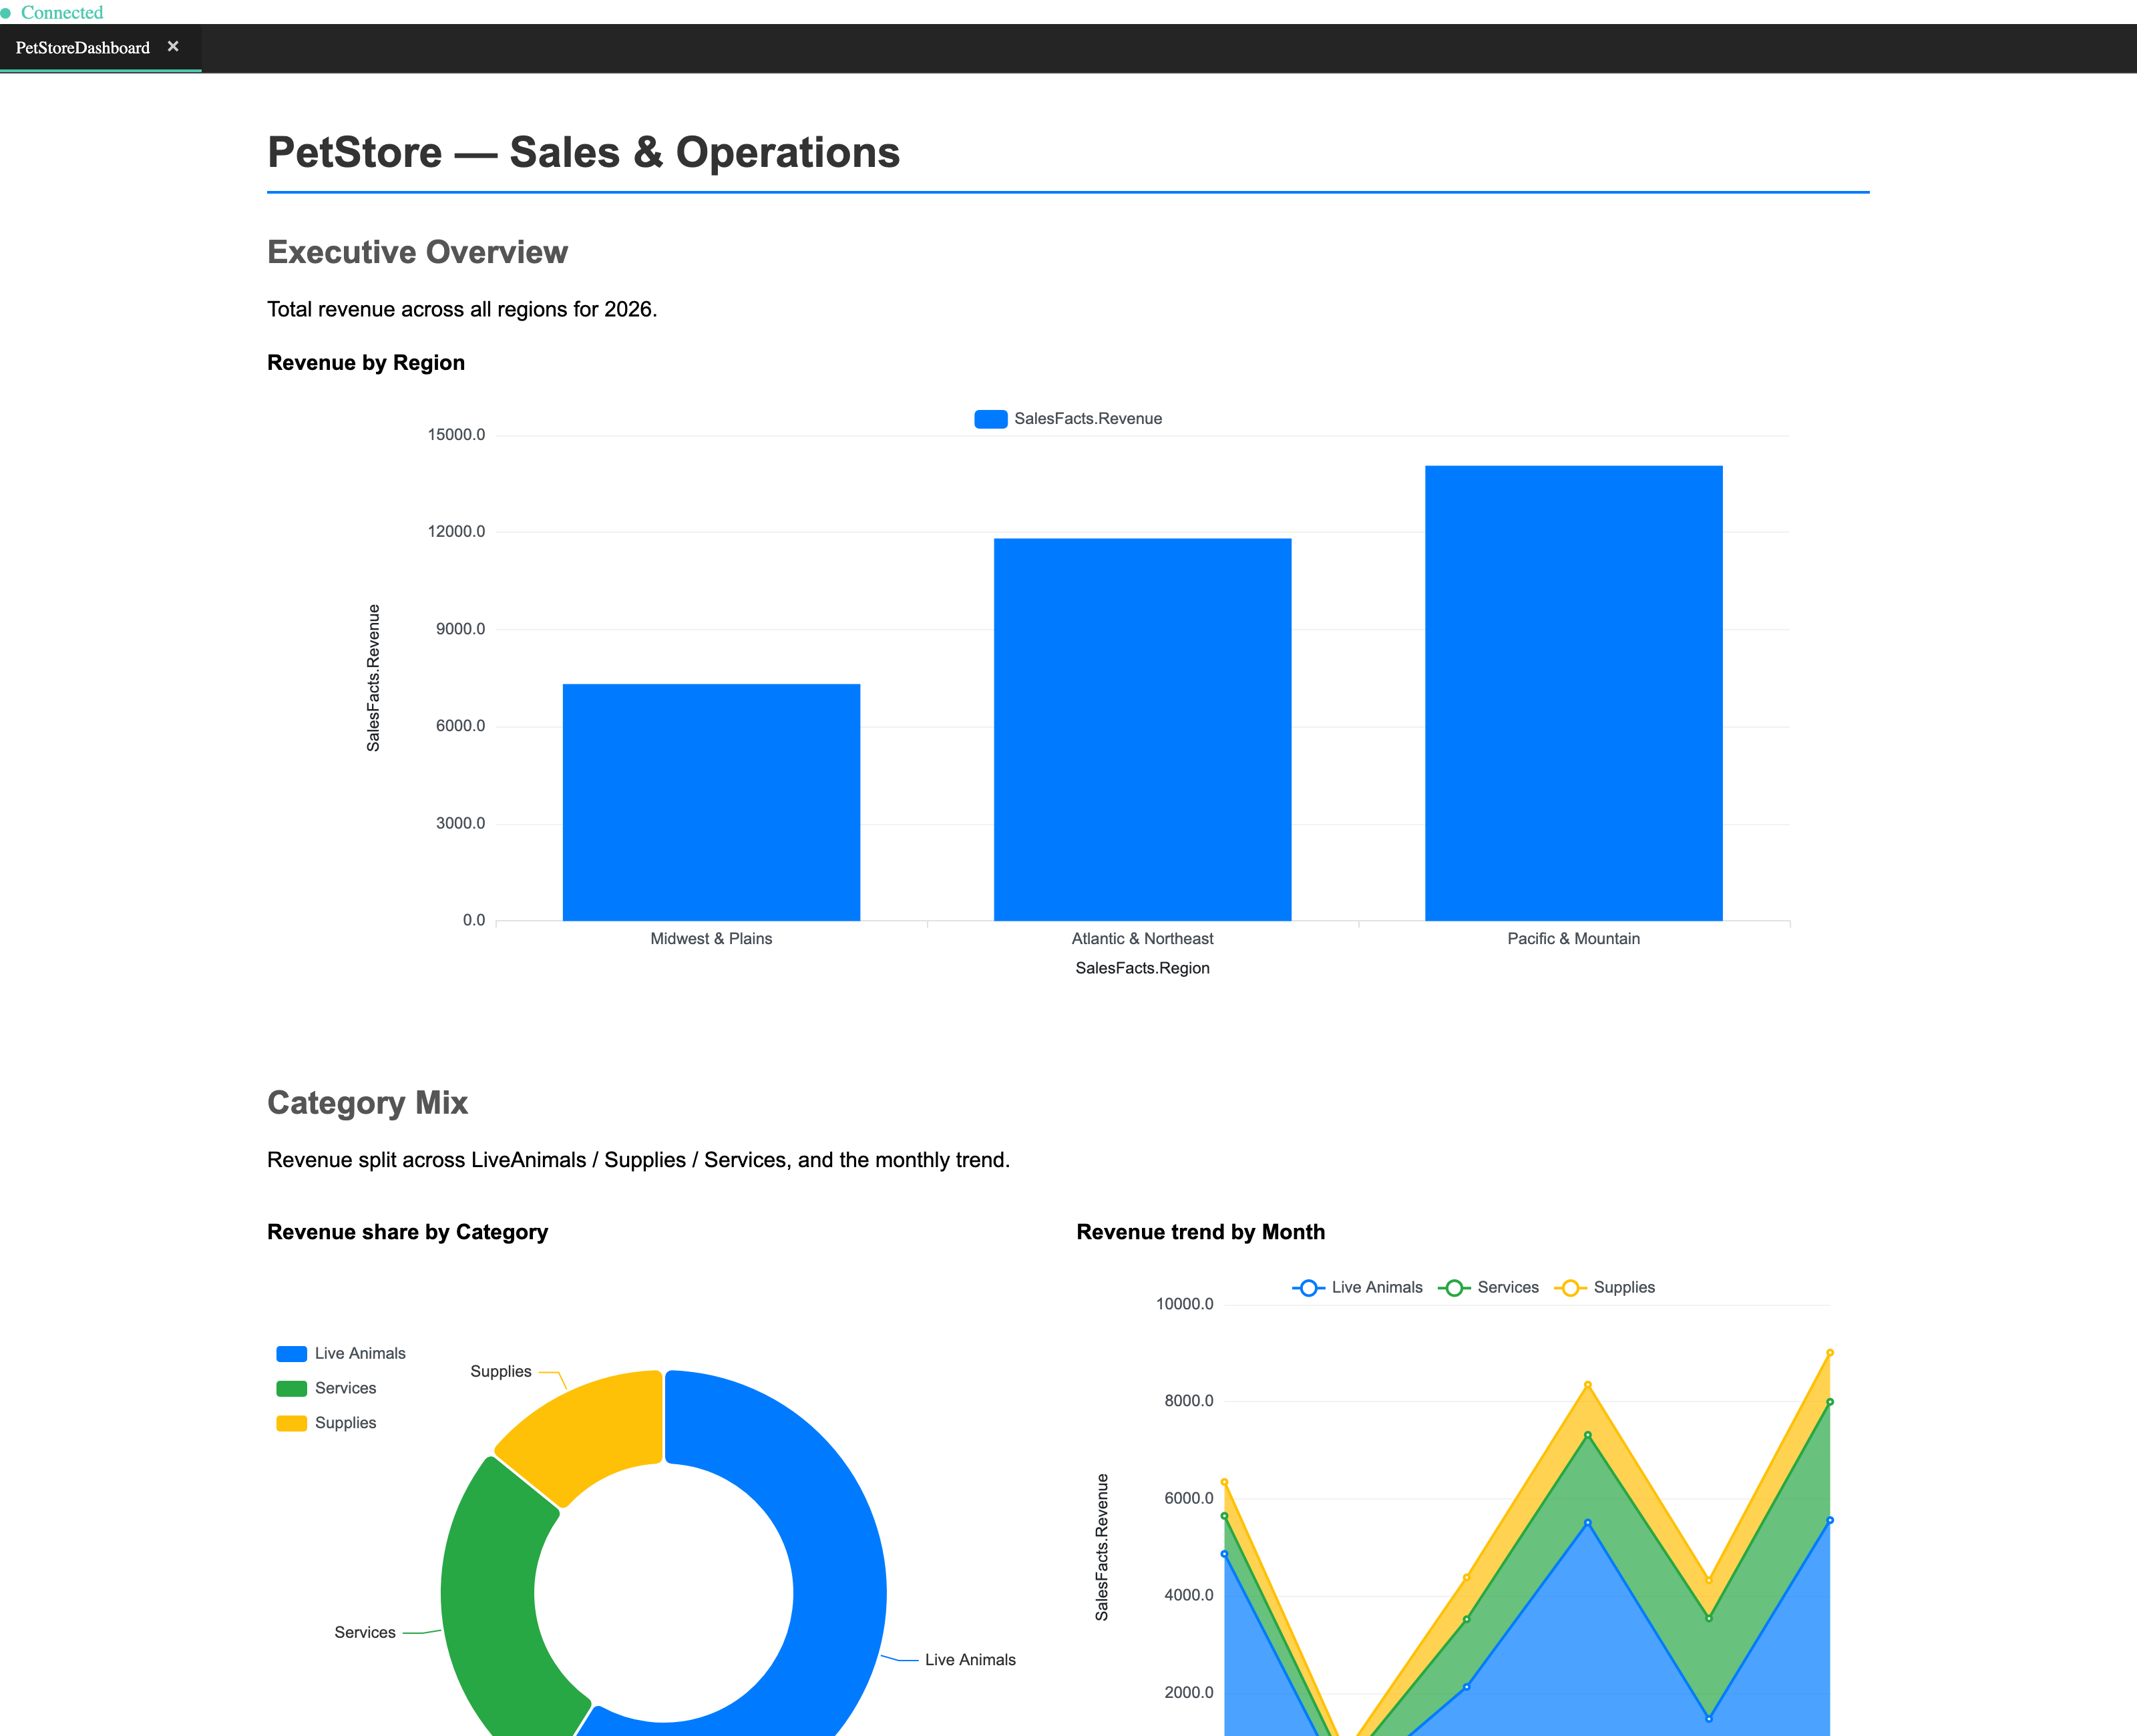
A REPORT is declared in the same language as the data model.
It composes sections, tables, graphs, and controls. State flows
through channels — typed,
scoped slots that carry filter values, selected coordinates, and
drilled-into context across the entire report surface.
Reports render as correct static HTML first; the reactive viewer overlays interactivity. This means reports are always readable — even before the client connects.
- 11 chart types: Bar, Line, Area, Pie, Donut, Scatter, HiLo, Gantt, Card, Gauge, Combo
- SECTION FOR — iterate over any dimension
- TAB and PINNED section render modes
- Channel cascade — scope by placement
- Slicer types: dropdown, range, checkbox, hierarchical
- PANEL AUTO — auto-generate controls
- Cross-visual chart-click → channel write
- Drill-across: jump with coordinates pinned
- Nested drill + breadcrumb navigation
- Dynamic hierarchy axis switching
- Scalable hierarchy picker (500+ values)
- Cell write-back — edits propagate through rules
- Row-window pagination for detail tables
- EXISTS IN membership filter (tag semi-join)
REPORT SalesDashboard
    TITLE "Monthly Book Sales"

    CHANNEL Genre  TYPE Text
    CHANNEL Period TYPE Date

    PANEL LEFT
        SLICER "Genre"  DIMENSION Genre CHANNEL Genre
        RANGE  "Period" DIMENSION Month CHANNEL Period
    END PANEL

    SECTION FOR Publisher.*
        SORT BY ORTHO Sales MEASURE Revenue DESCENDING

        GRAPH "Sales by Month"
            SOURCE ORTHO Sales
            FILTER Genre = @Genre
            PLOT    Month
            MEASURES Units, Revenue
            TYPE BAR
            ON CLICK NAVIGATE Detail
                CHANNEL Month = CONTEXT
            END NAVIGATE
        END GRAPH
    END SECTION
END REPORT
Slicers, channels, dimensional iteration, filter context, chart click navigation — all declared, none wired by hand.
The Polytope report viewer renders PML declarations as fully interactive reports in the browser. The HTML output is correct before the client connects; the viewer overlays live channel updates via WebSocket without page reloads.
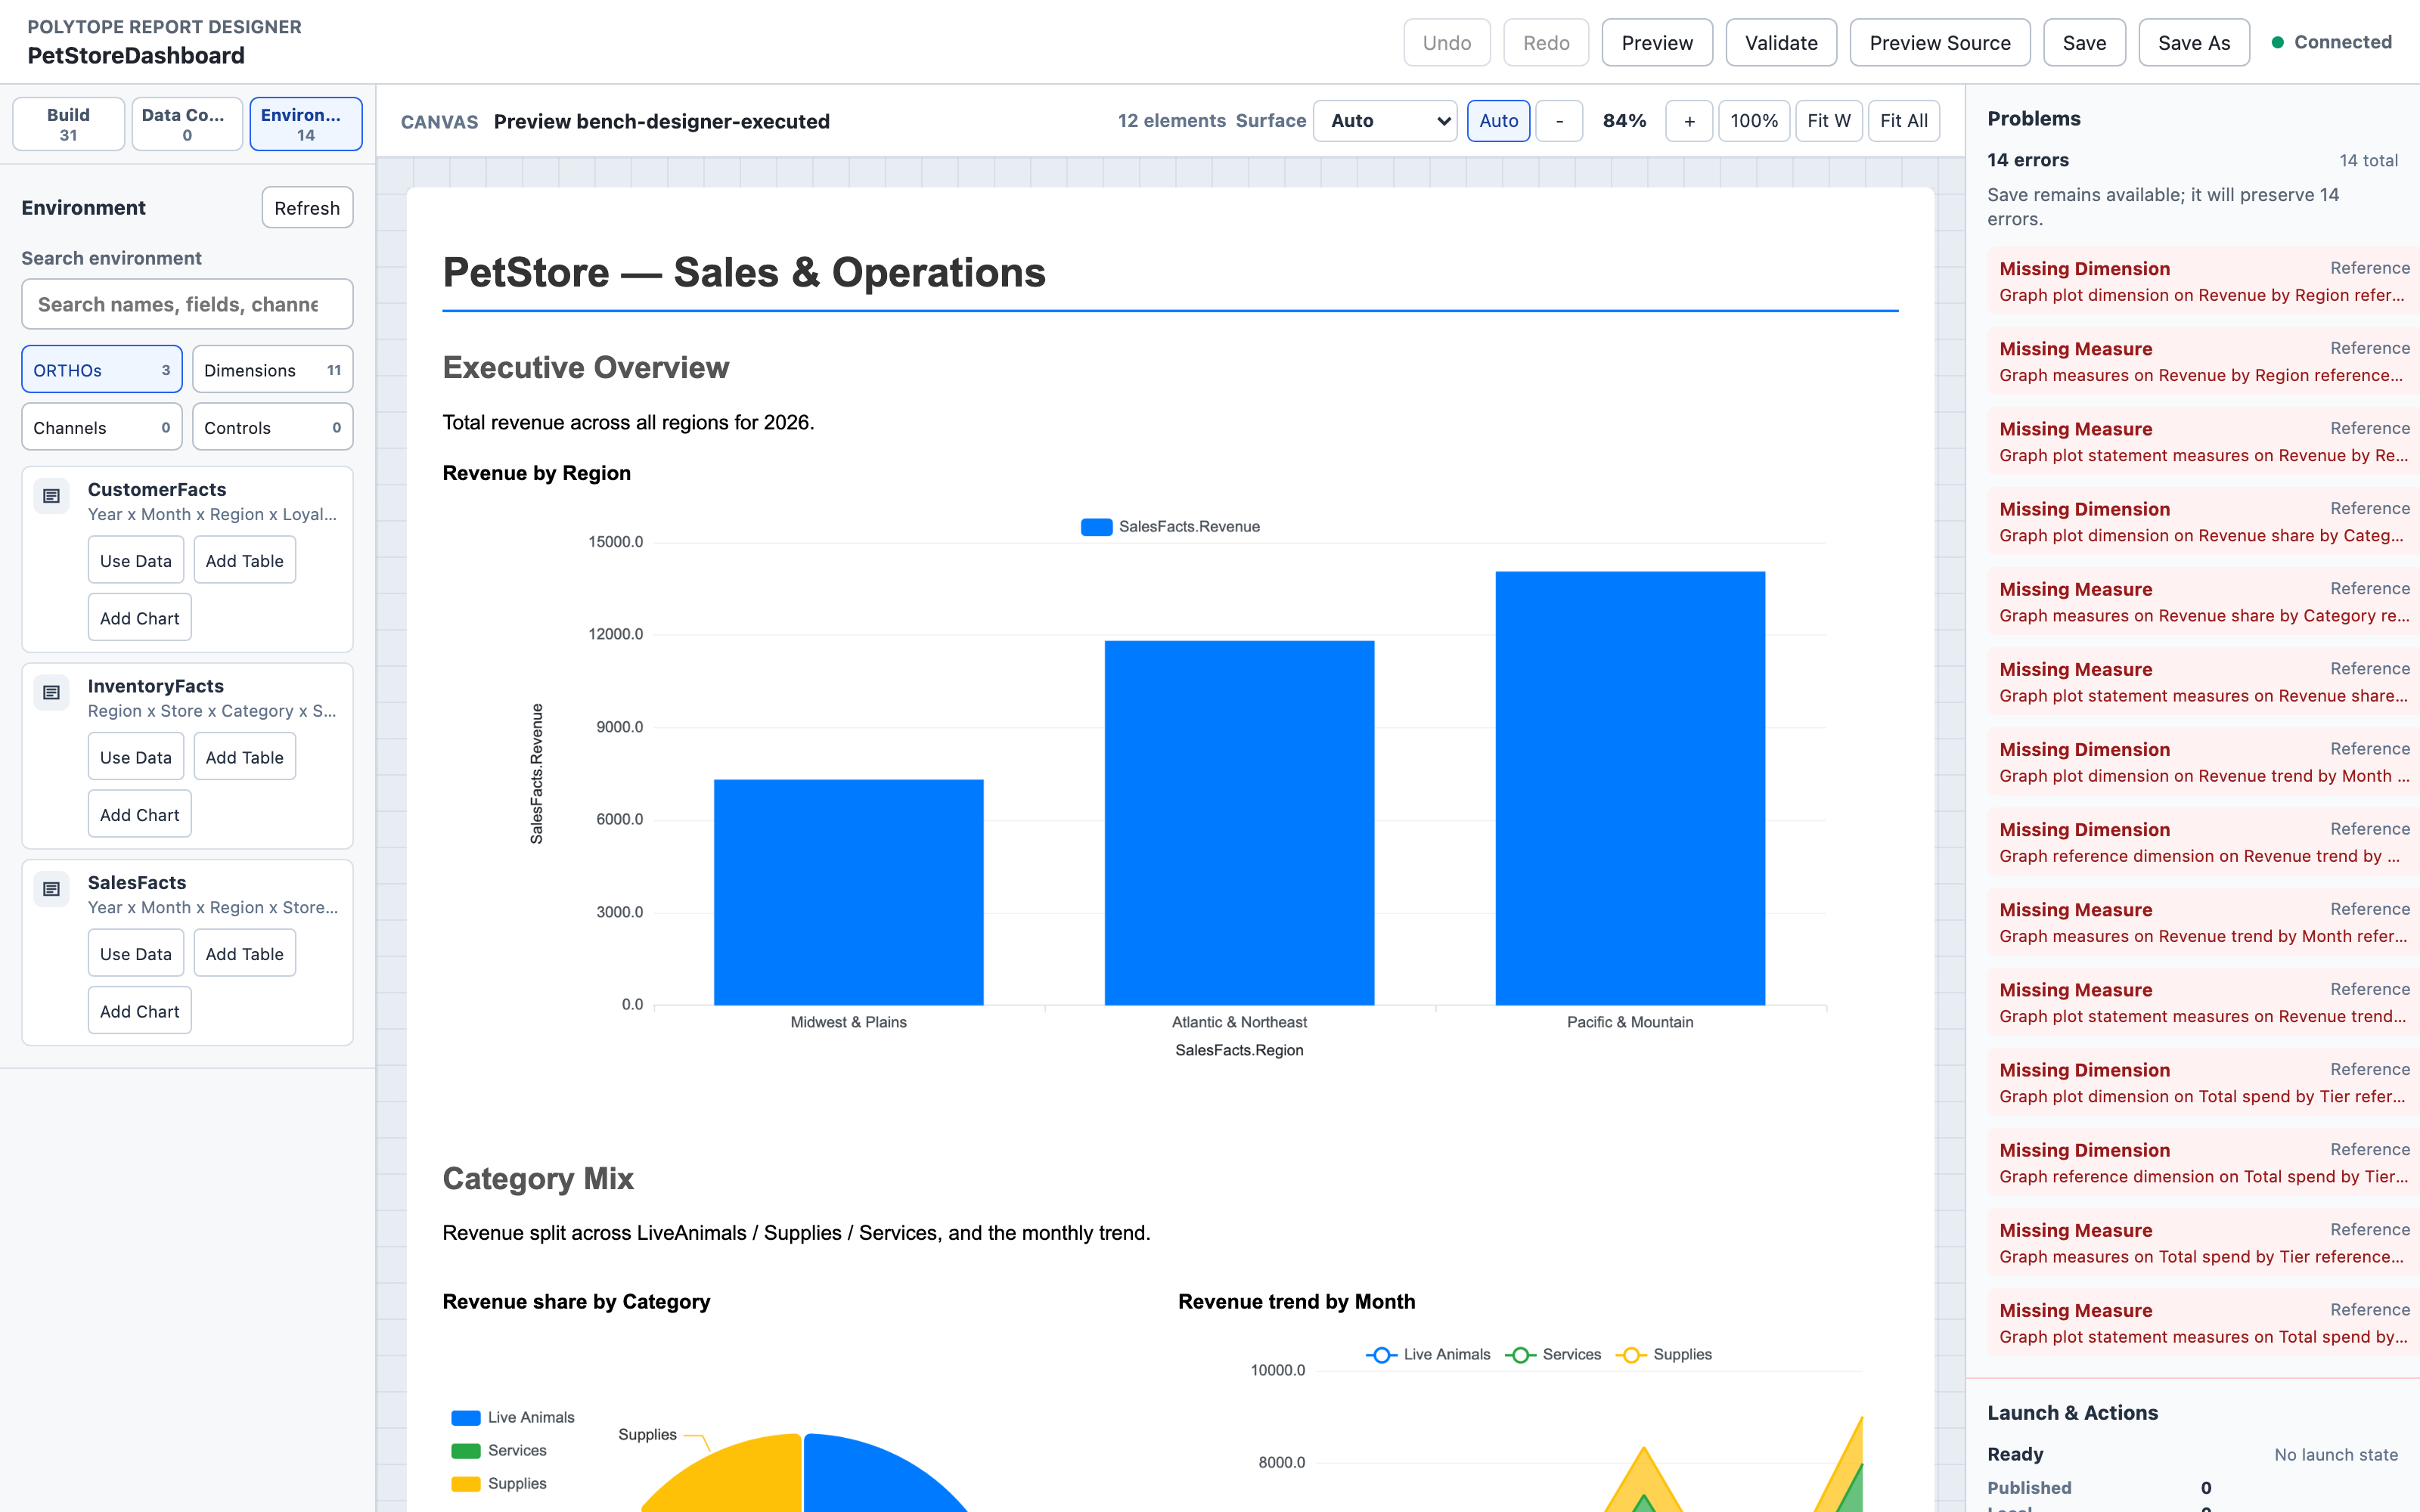
06 · Report designer
Visual authoring,
PML underneath.
The report designer is a drag-and-drop canvas that generates PML source. Every visual edit round-trips to the underlying declaration — the designer is an authoring surface, not a separate format. Undo and redo operate across the full session history.
Canvas & layout
- Drag-and-drop insertion from gallery
- 8-way resize handles, multi-select
- Snap grid, nudge, distribute, align
- Real-time WYSIWYG preview (same renderer)
Build gallery
- All chart types, tables, text, frames
- Channels, slicers, params, ranges, drills
- Navigate blocks, panels, layout wrappers
- 5 composition templates (Overview, Trend, …)
Start from data
- Choose layout pattern + dimensions + measures
- Generates a complete working report
- Source compatibility checking
- Single undoable transaction
Connect to
- Infer compatible sources automatically
- Bind channels to visuals in one click
- Create literal filter + slicer pairs
- Catalog-backed field suggestions
Validation
- Real-time green / yellow / red badges
- Diagnostics panel with fix suggestions
- Undefined channel, dim mismatch detection
- Common fixes offered inline
AI agent panel
- Agent proposes designer edits in natural language
- Applies changes as undoable transactions
- Explains proposed changes before applying
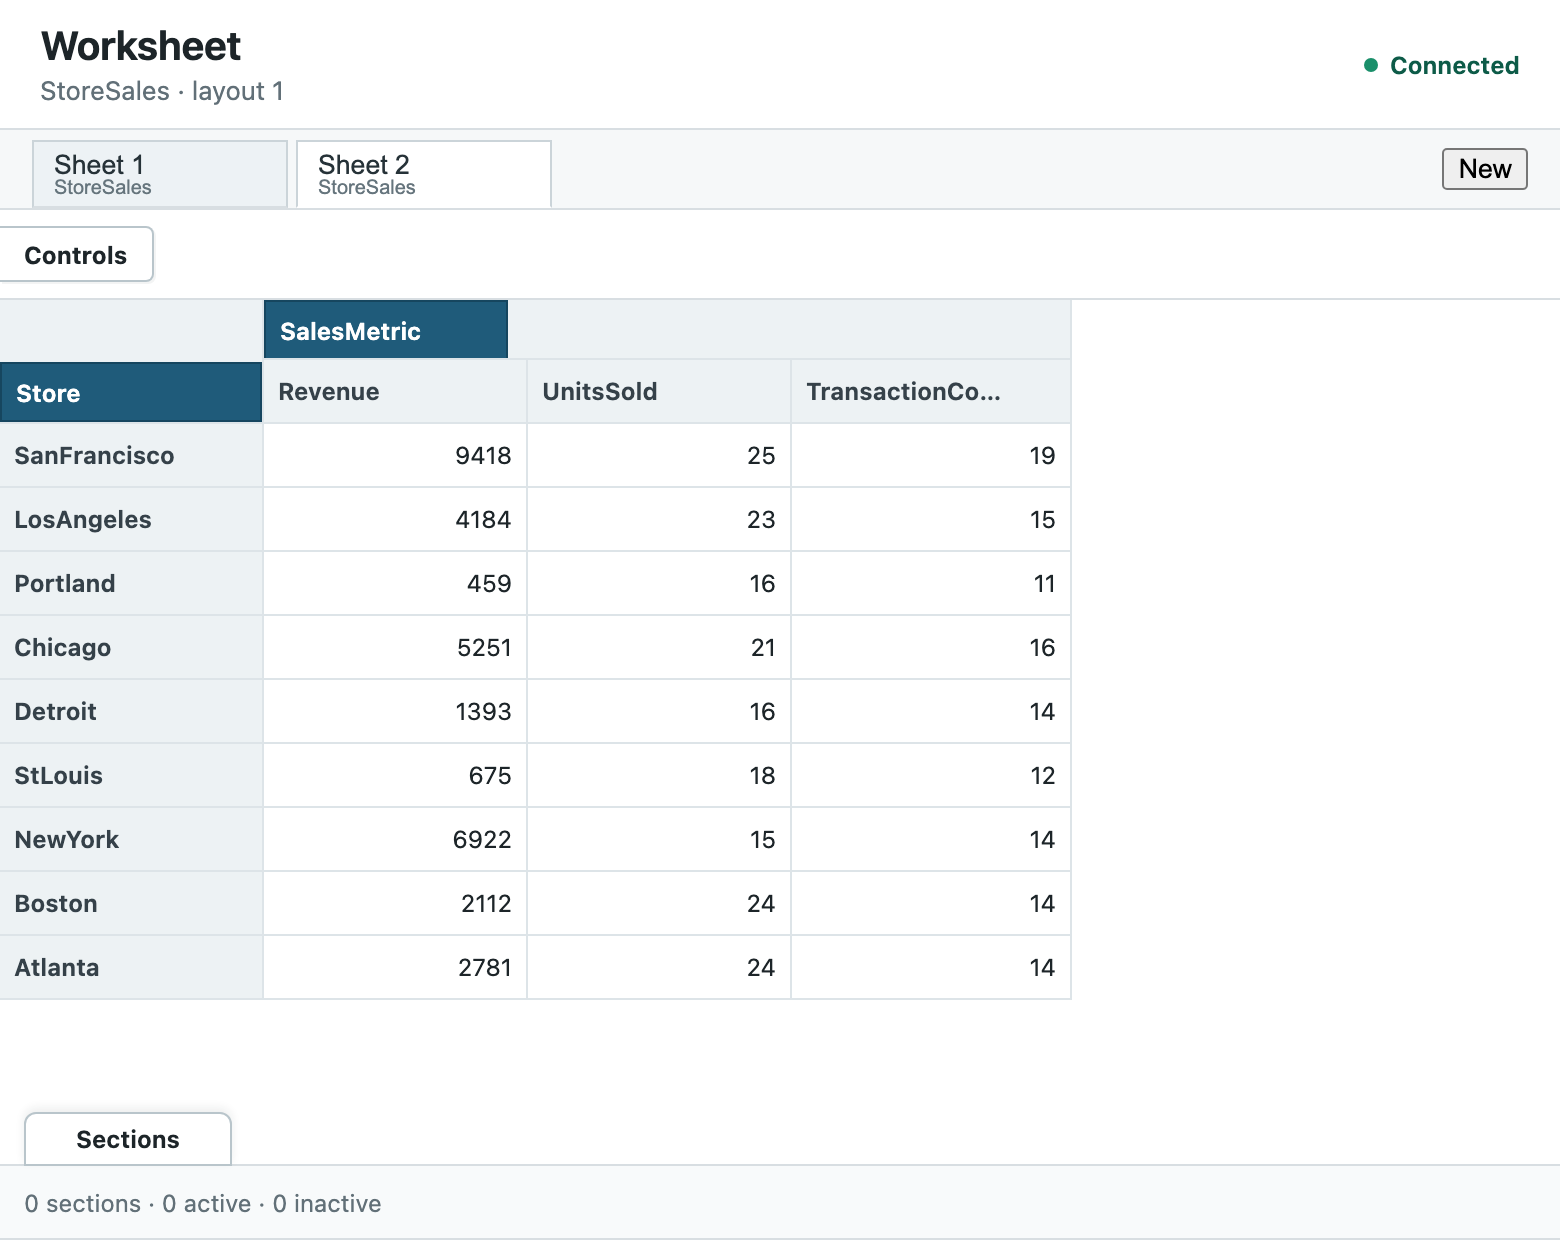
07 · Worksheet
Pivot grid with
a live engine underneath.
The worksheet surfaces an ORTHO or MODEL as an editable pivot grid. Dimensions map to rows, columns, and section pins; the grid responds live to cell edits, propagating changes through the reactive cascade. Named views persist layout configurations.
- Open any ORTHO or MODEL directly
- Pivot: assign dims to rows / columns / pins
- Hierarchical expand / collapse
- In-cell editing with cascade propagation
- Rectangular paste — bulk cell update
- Multi-key column and header sort
- Sparse row/column hiding
- Cell search across the grid
- Named views — save and restore layouts
- Rule ownership — which rule wrote this cell?
- Worksheet totals (non-writable summary rows)
- Model authoring: add fields, recompose
08 · Data & SQL
Load from anywhere.
Expose to any tool.
ORTHOs load from SQL queries, CSV files, or other ORTHOs. Virtual ORTHOs stay SQL-backed with lazy or prefetch loading. A PostgreSQL foreign data wrapper exposes any ORTHO as a canonical relational table — readable and writable from any SQL tool, with aggregate pushdown into the Polytope engine.
The warm storage system persists pre-computed ORTHO generations to disk. On restart or new tenant, a generation attaches to memory in seconds rather than requiring a full recalculation pass.
- SOURCE SELECT — SQL query to ORTHO
- Virtual ORTHOs — lazy or full preload
- CSV / file import with field mapping
- Dynamic field creation from data
- SQLite, PostgreSQL, Oracle, Sybase, DB2
- Database-agnostic SQL generation
- SQL schema mapping utility
- PostgreSQL FDW + SQL gateway
- Canonical long/narrow ORTHO tables
- INSERT / UPDATE / DELETE write-back
- SUM / AVG / MIN / MAX / COUNT pushdown
- Warm storage: fast-attach pre-computed generations
- Background repopulation while serving
- Multi-tenant generation partitioning
// Virtual ORTHO — maps SQL directly to dimensions
ORTHO Sales
    DIMENSIONS Title, Genre, Month
    SOURCE SELECT
        title_id        AS Title,
        genre_code      AS Genre,
        sale_month      AS Month,
        units_sold,
        revenue
    FROM book_sales
    WHERE store_id = :store_id
END ORTHO

// Expose to SQL tools via the PostgreSQL FDW:
//   SELECT genre_code, AVG(value_double)
//   FROM sales_values
//   GROUP BY genre_code
SQL gateway
The Polytope PostgreSQL foreign data wrapper exposes any ORTHO as
a canonical relational table. BI tools query it with standard SQL;
the gateway translates predicates, projections, and aggregates into
native Polytope engine operations. Write-back flows through the same
path — INSERT, UPDATE, and DELETE reach the reactive cascade.
Queries from external tools reach Polytope semantics, not a materialized copy. Aggregate results respect the live model.